Resultaat
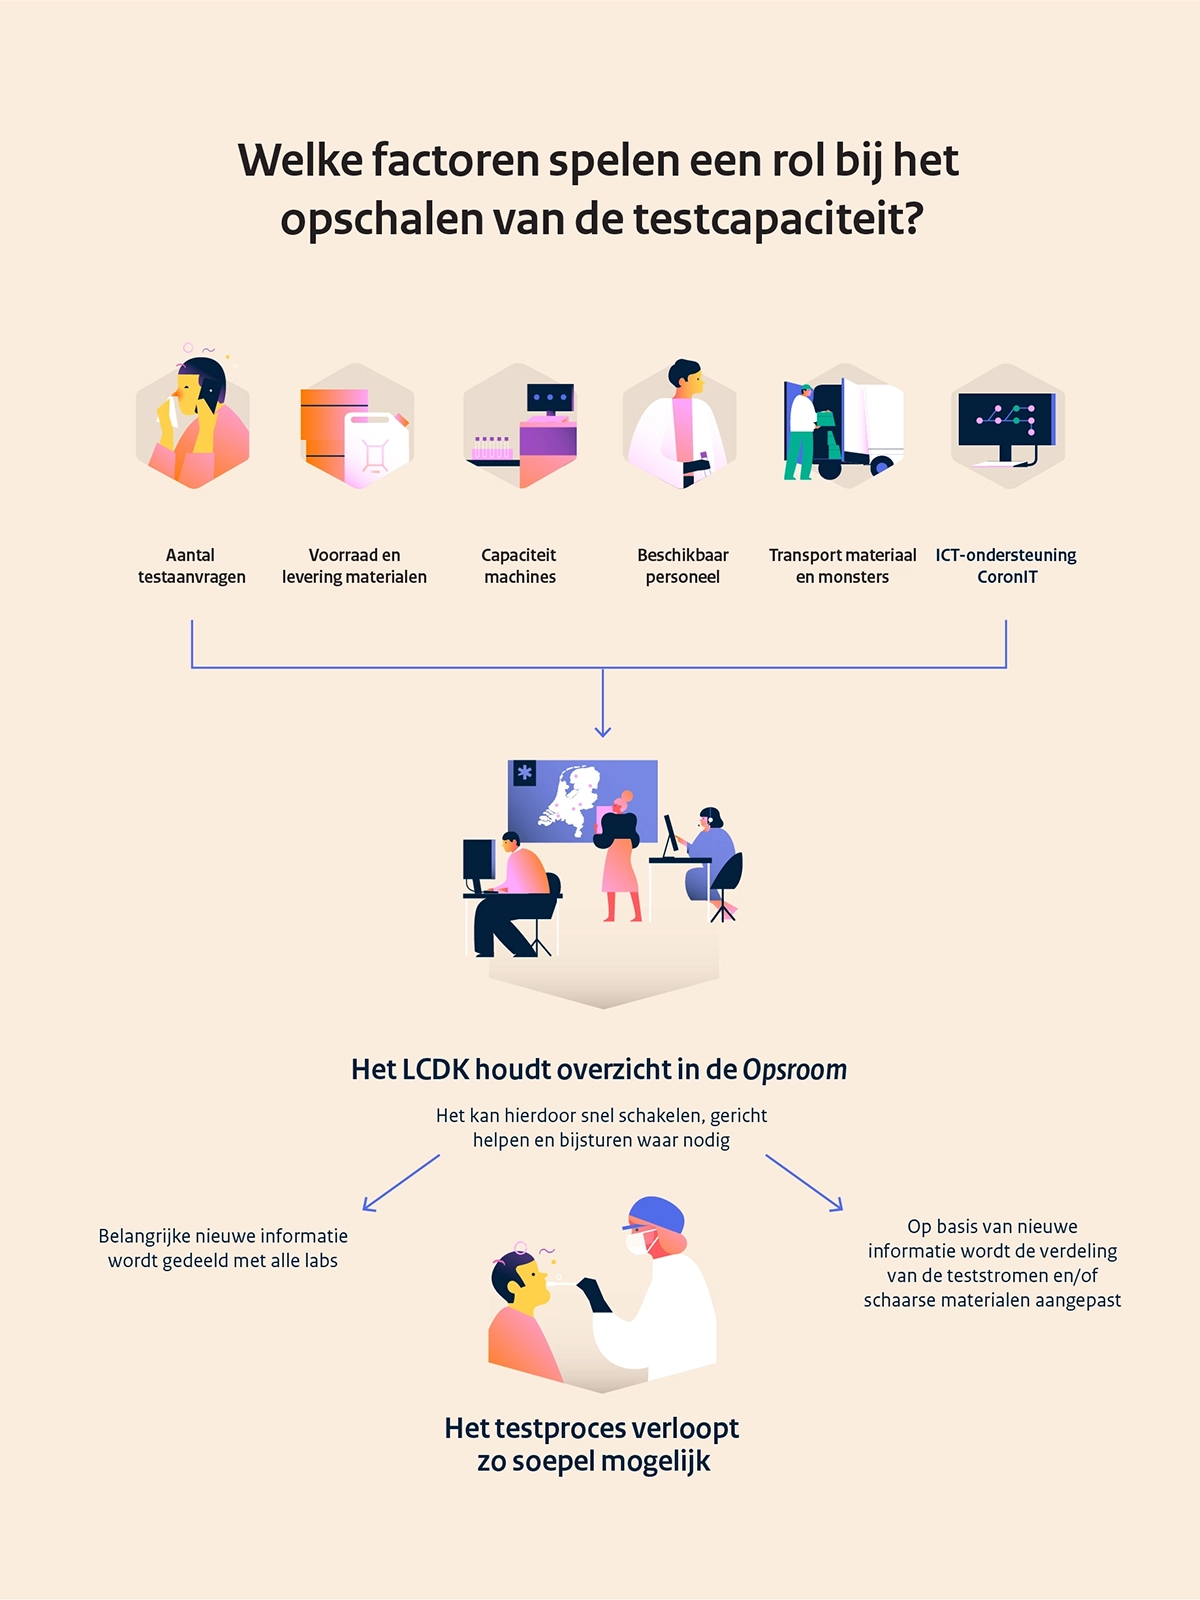
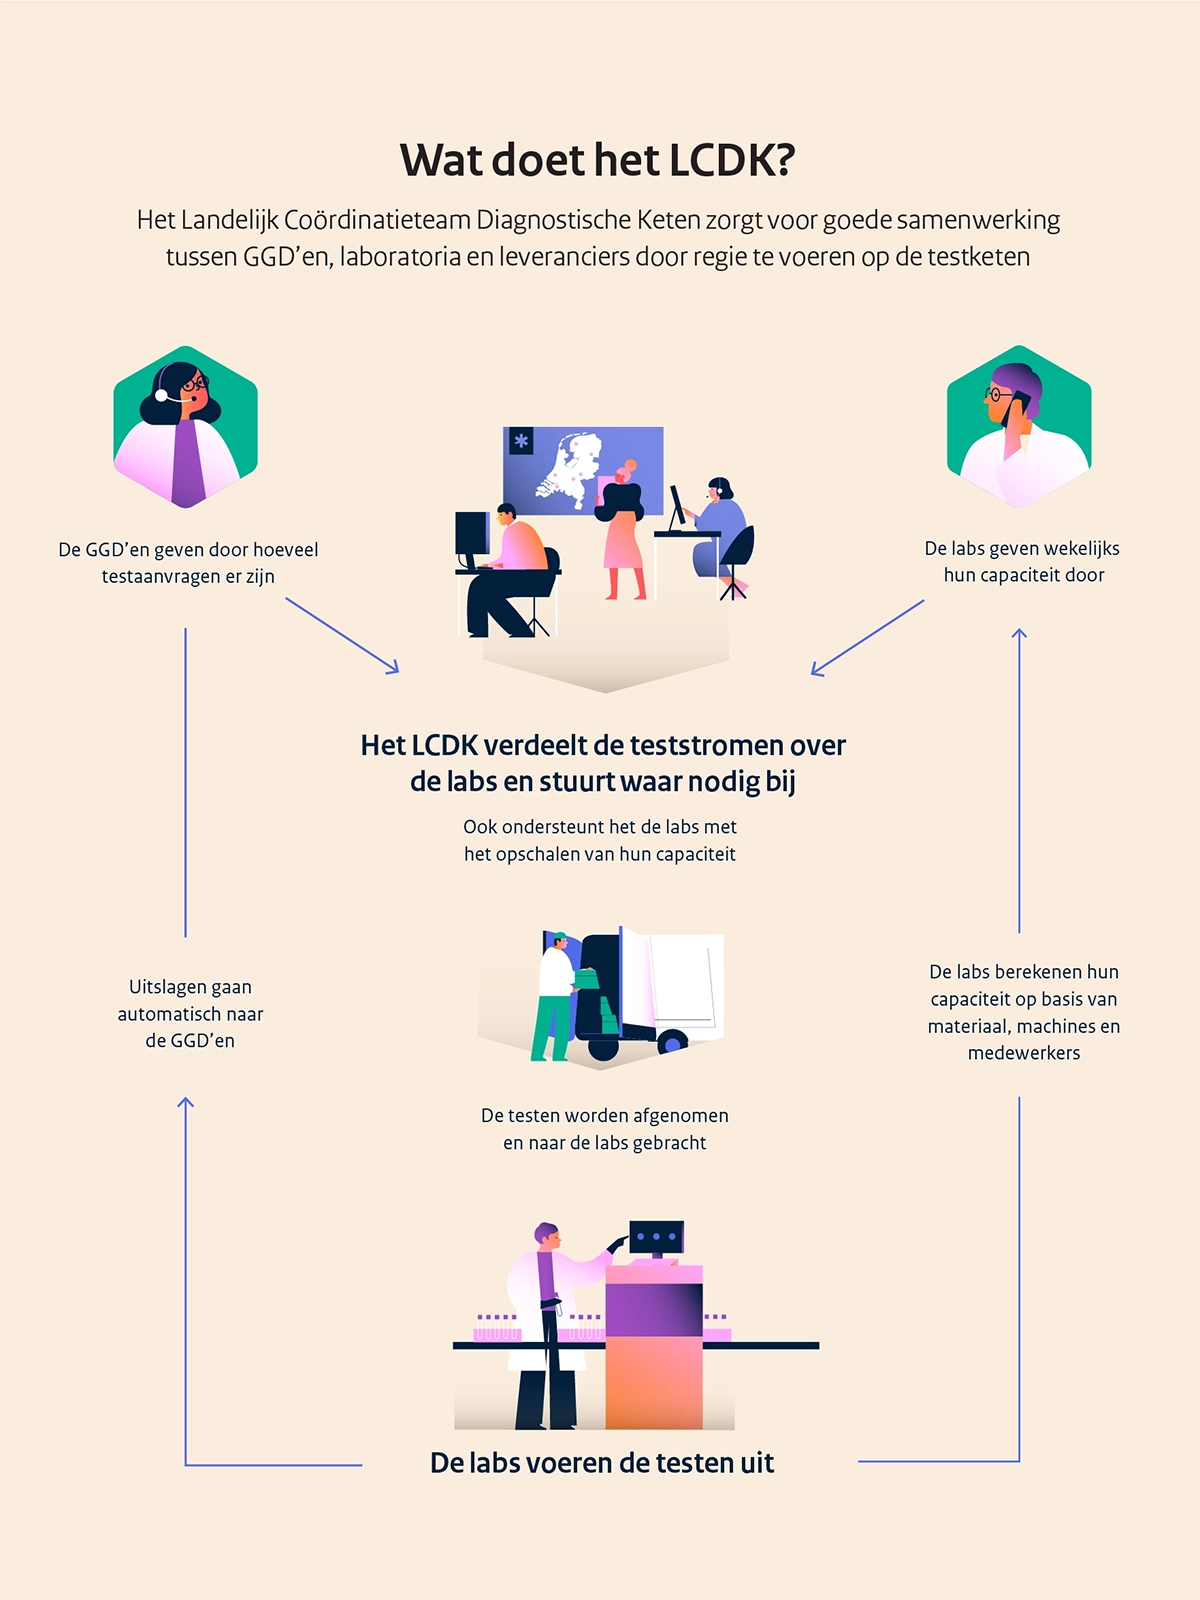
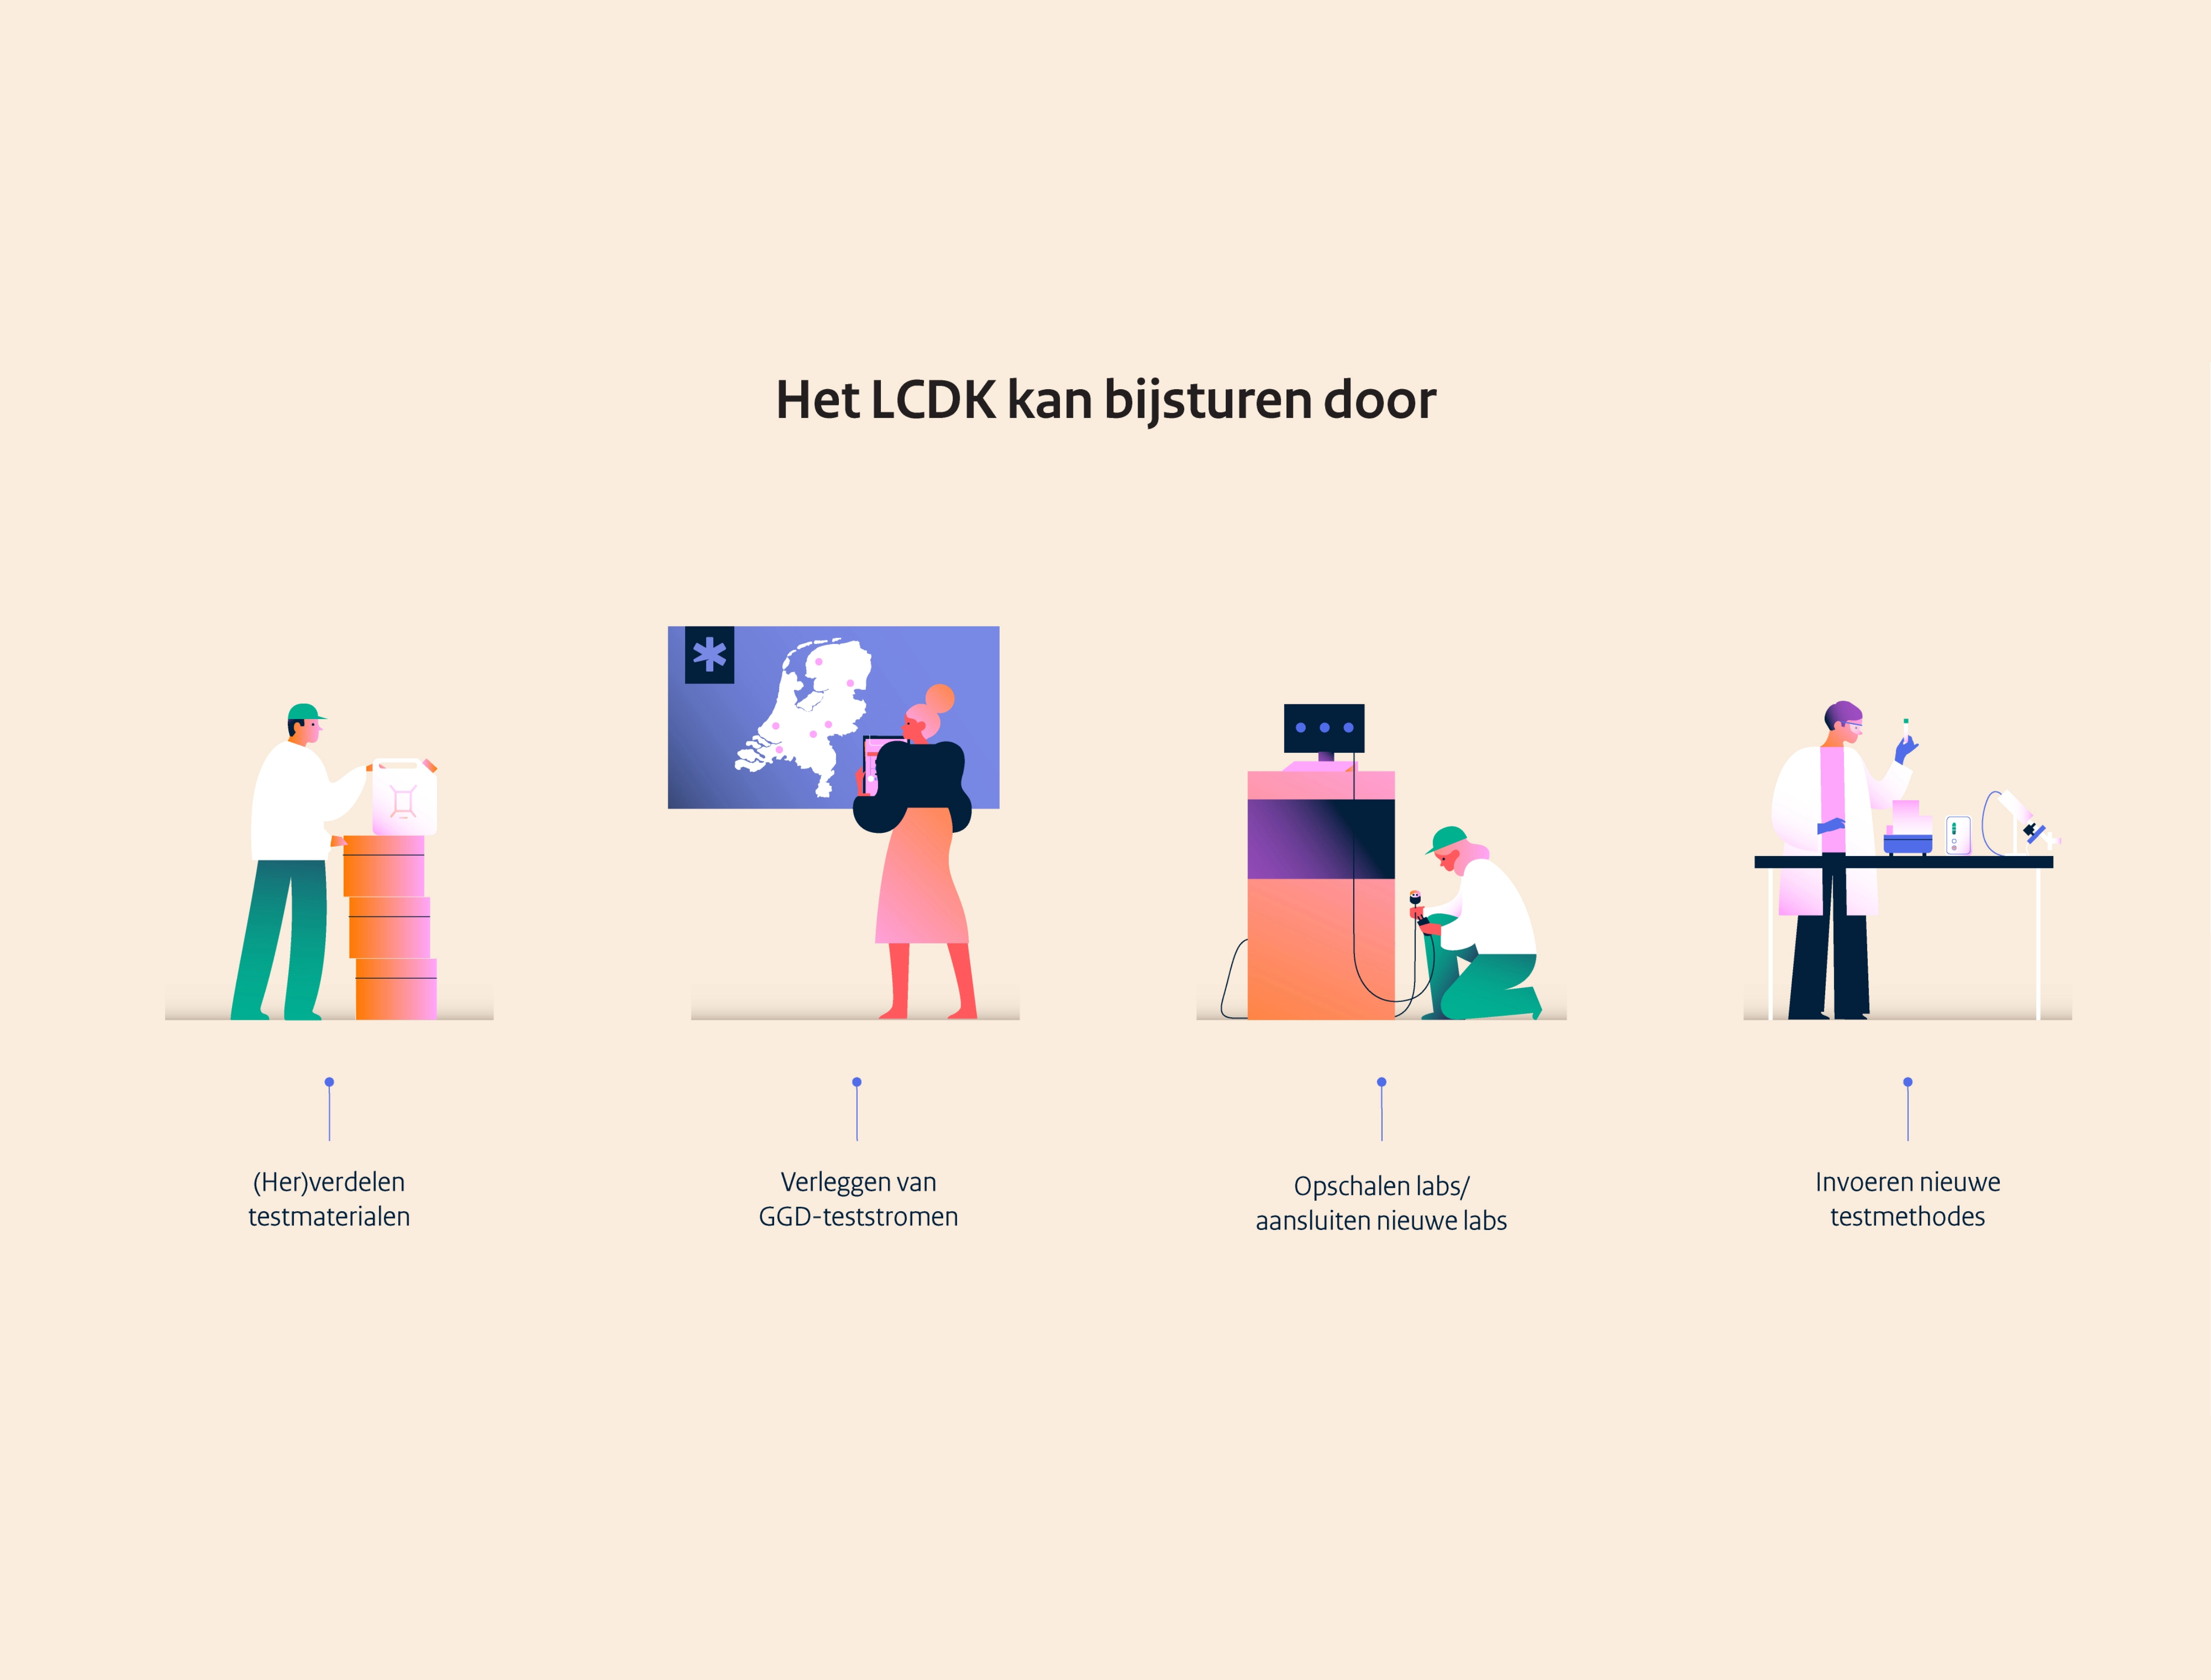
Heldere infographics die in één oogopslag tonen waar het over gaat.
Inzicht in complexe processen.
Een duidelijk beeld van de structuur van de organisatie. Ook goed te gebruiken in een onboarding procedure.
Designing infographics for a chain in progress
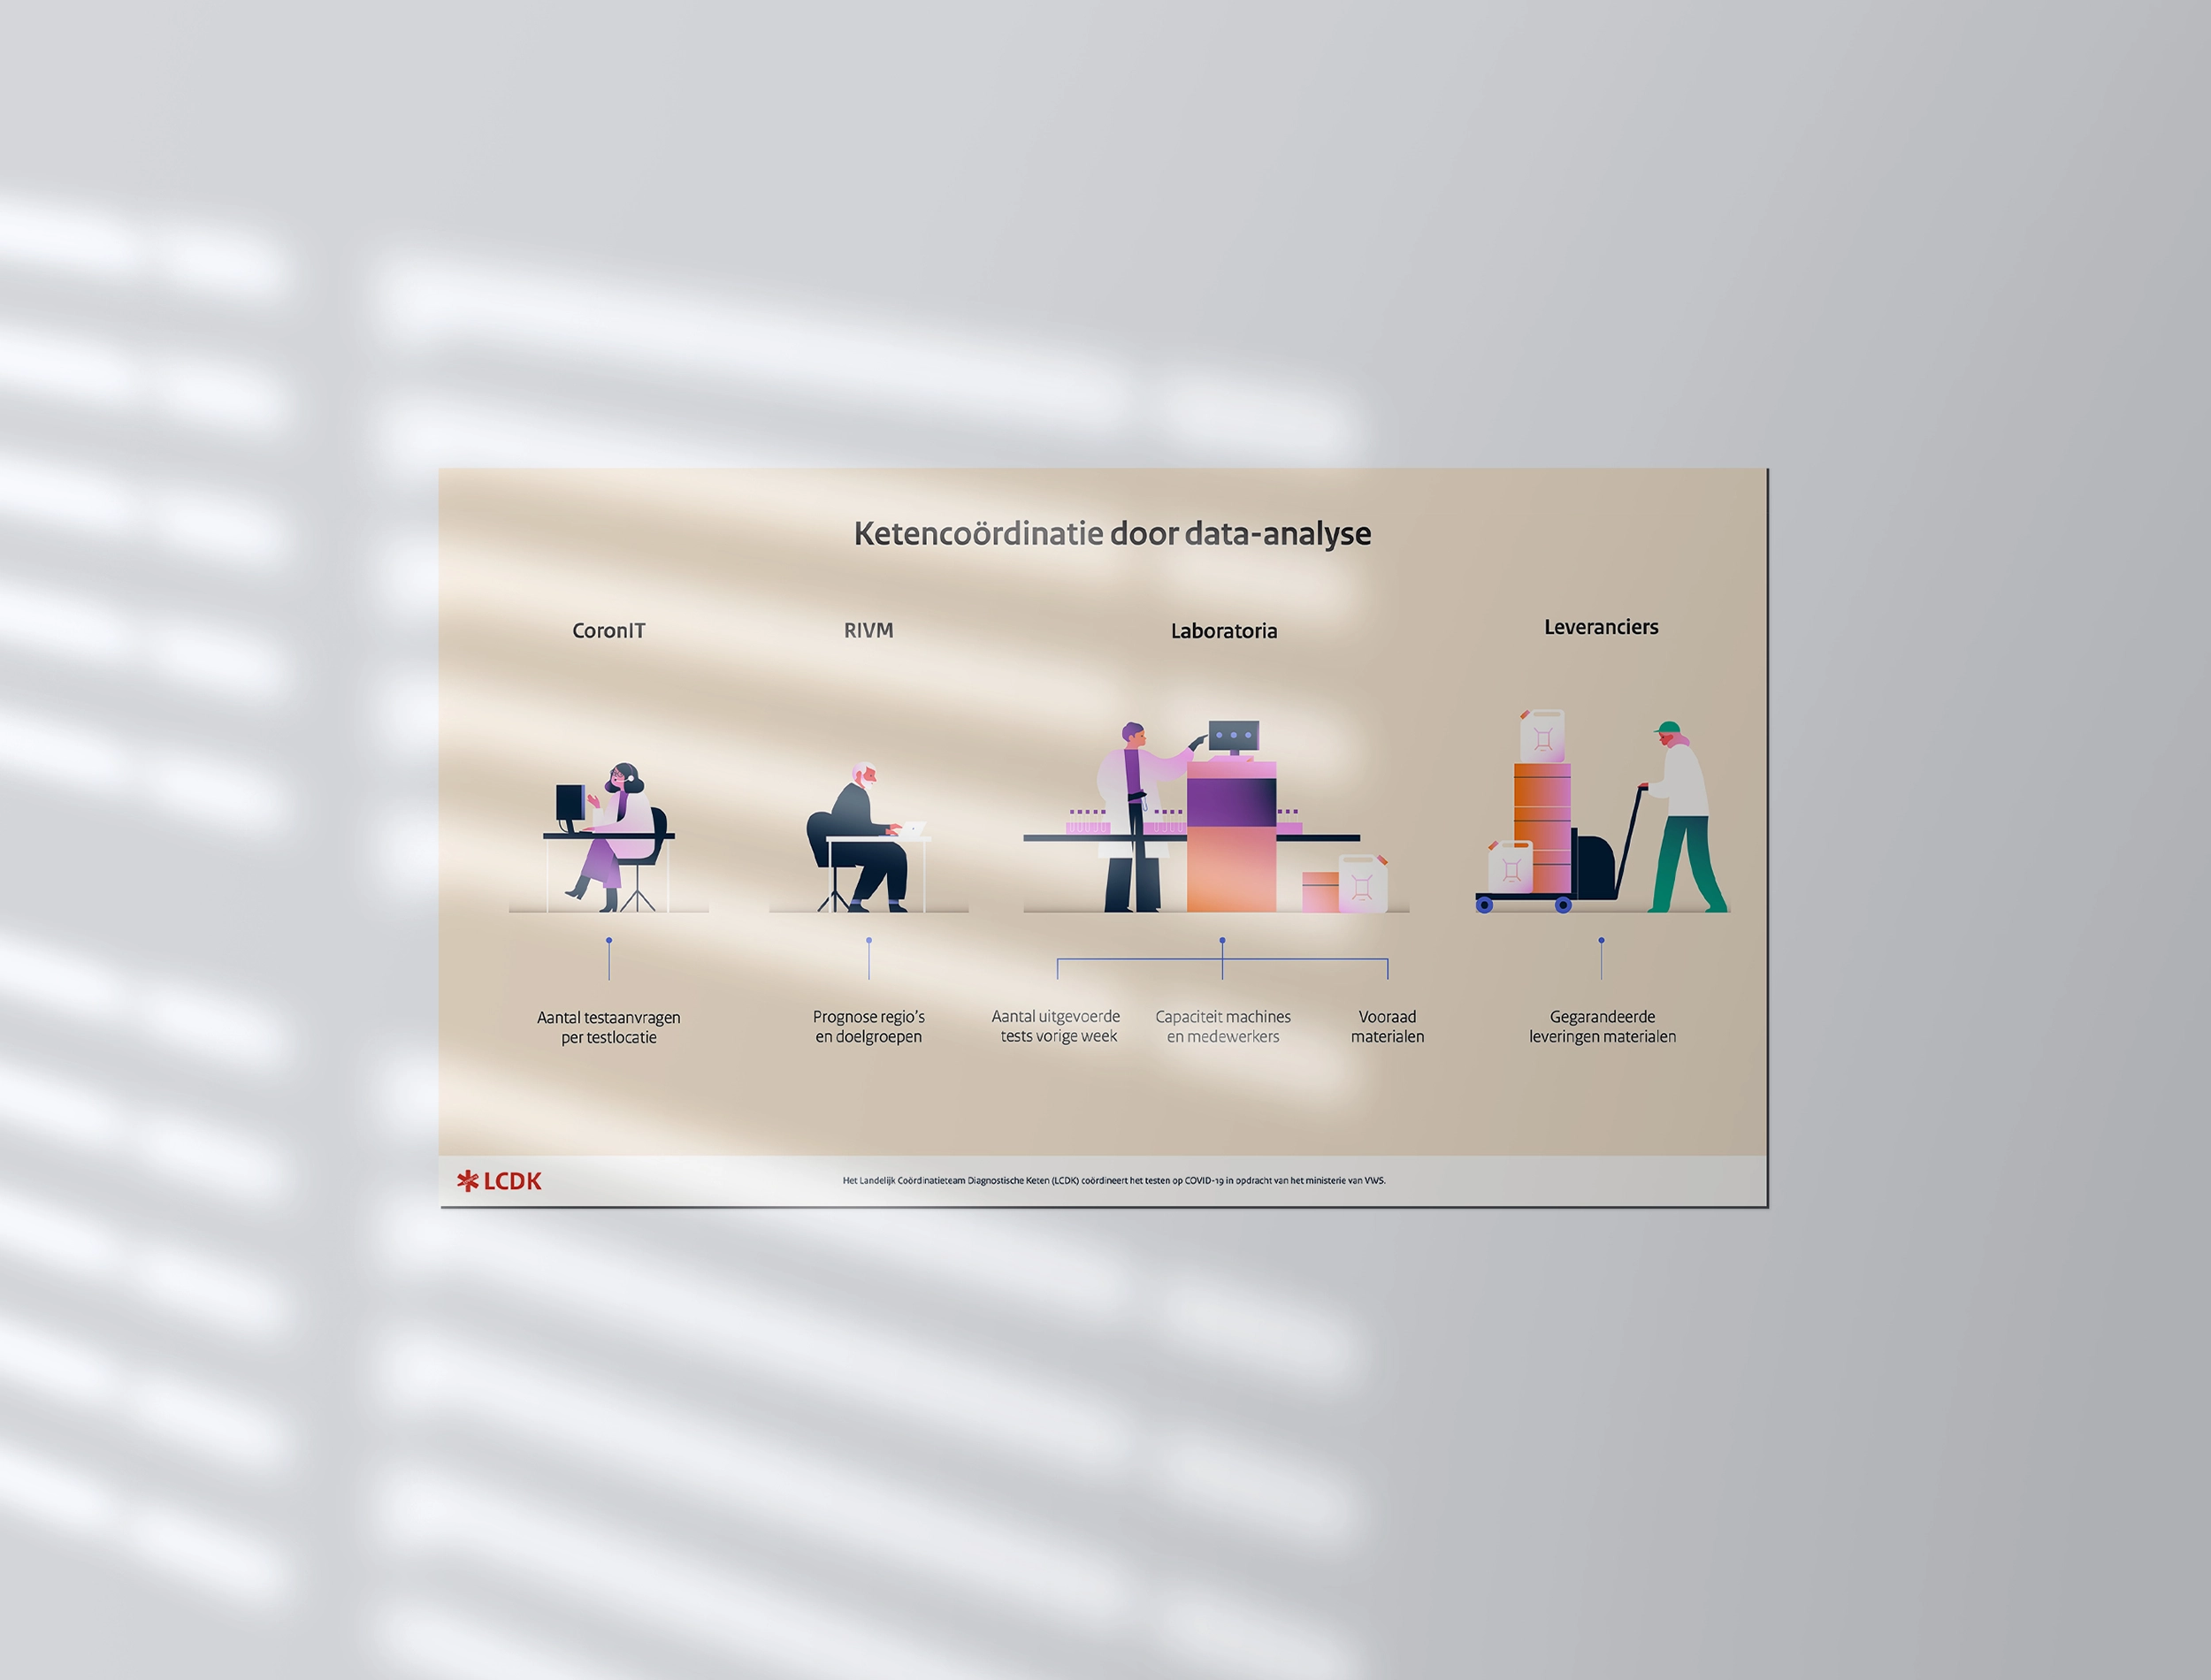
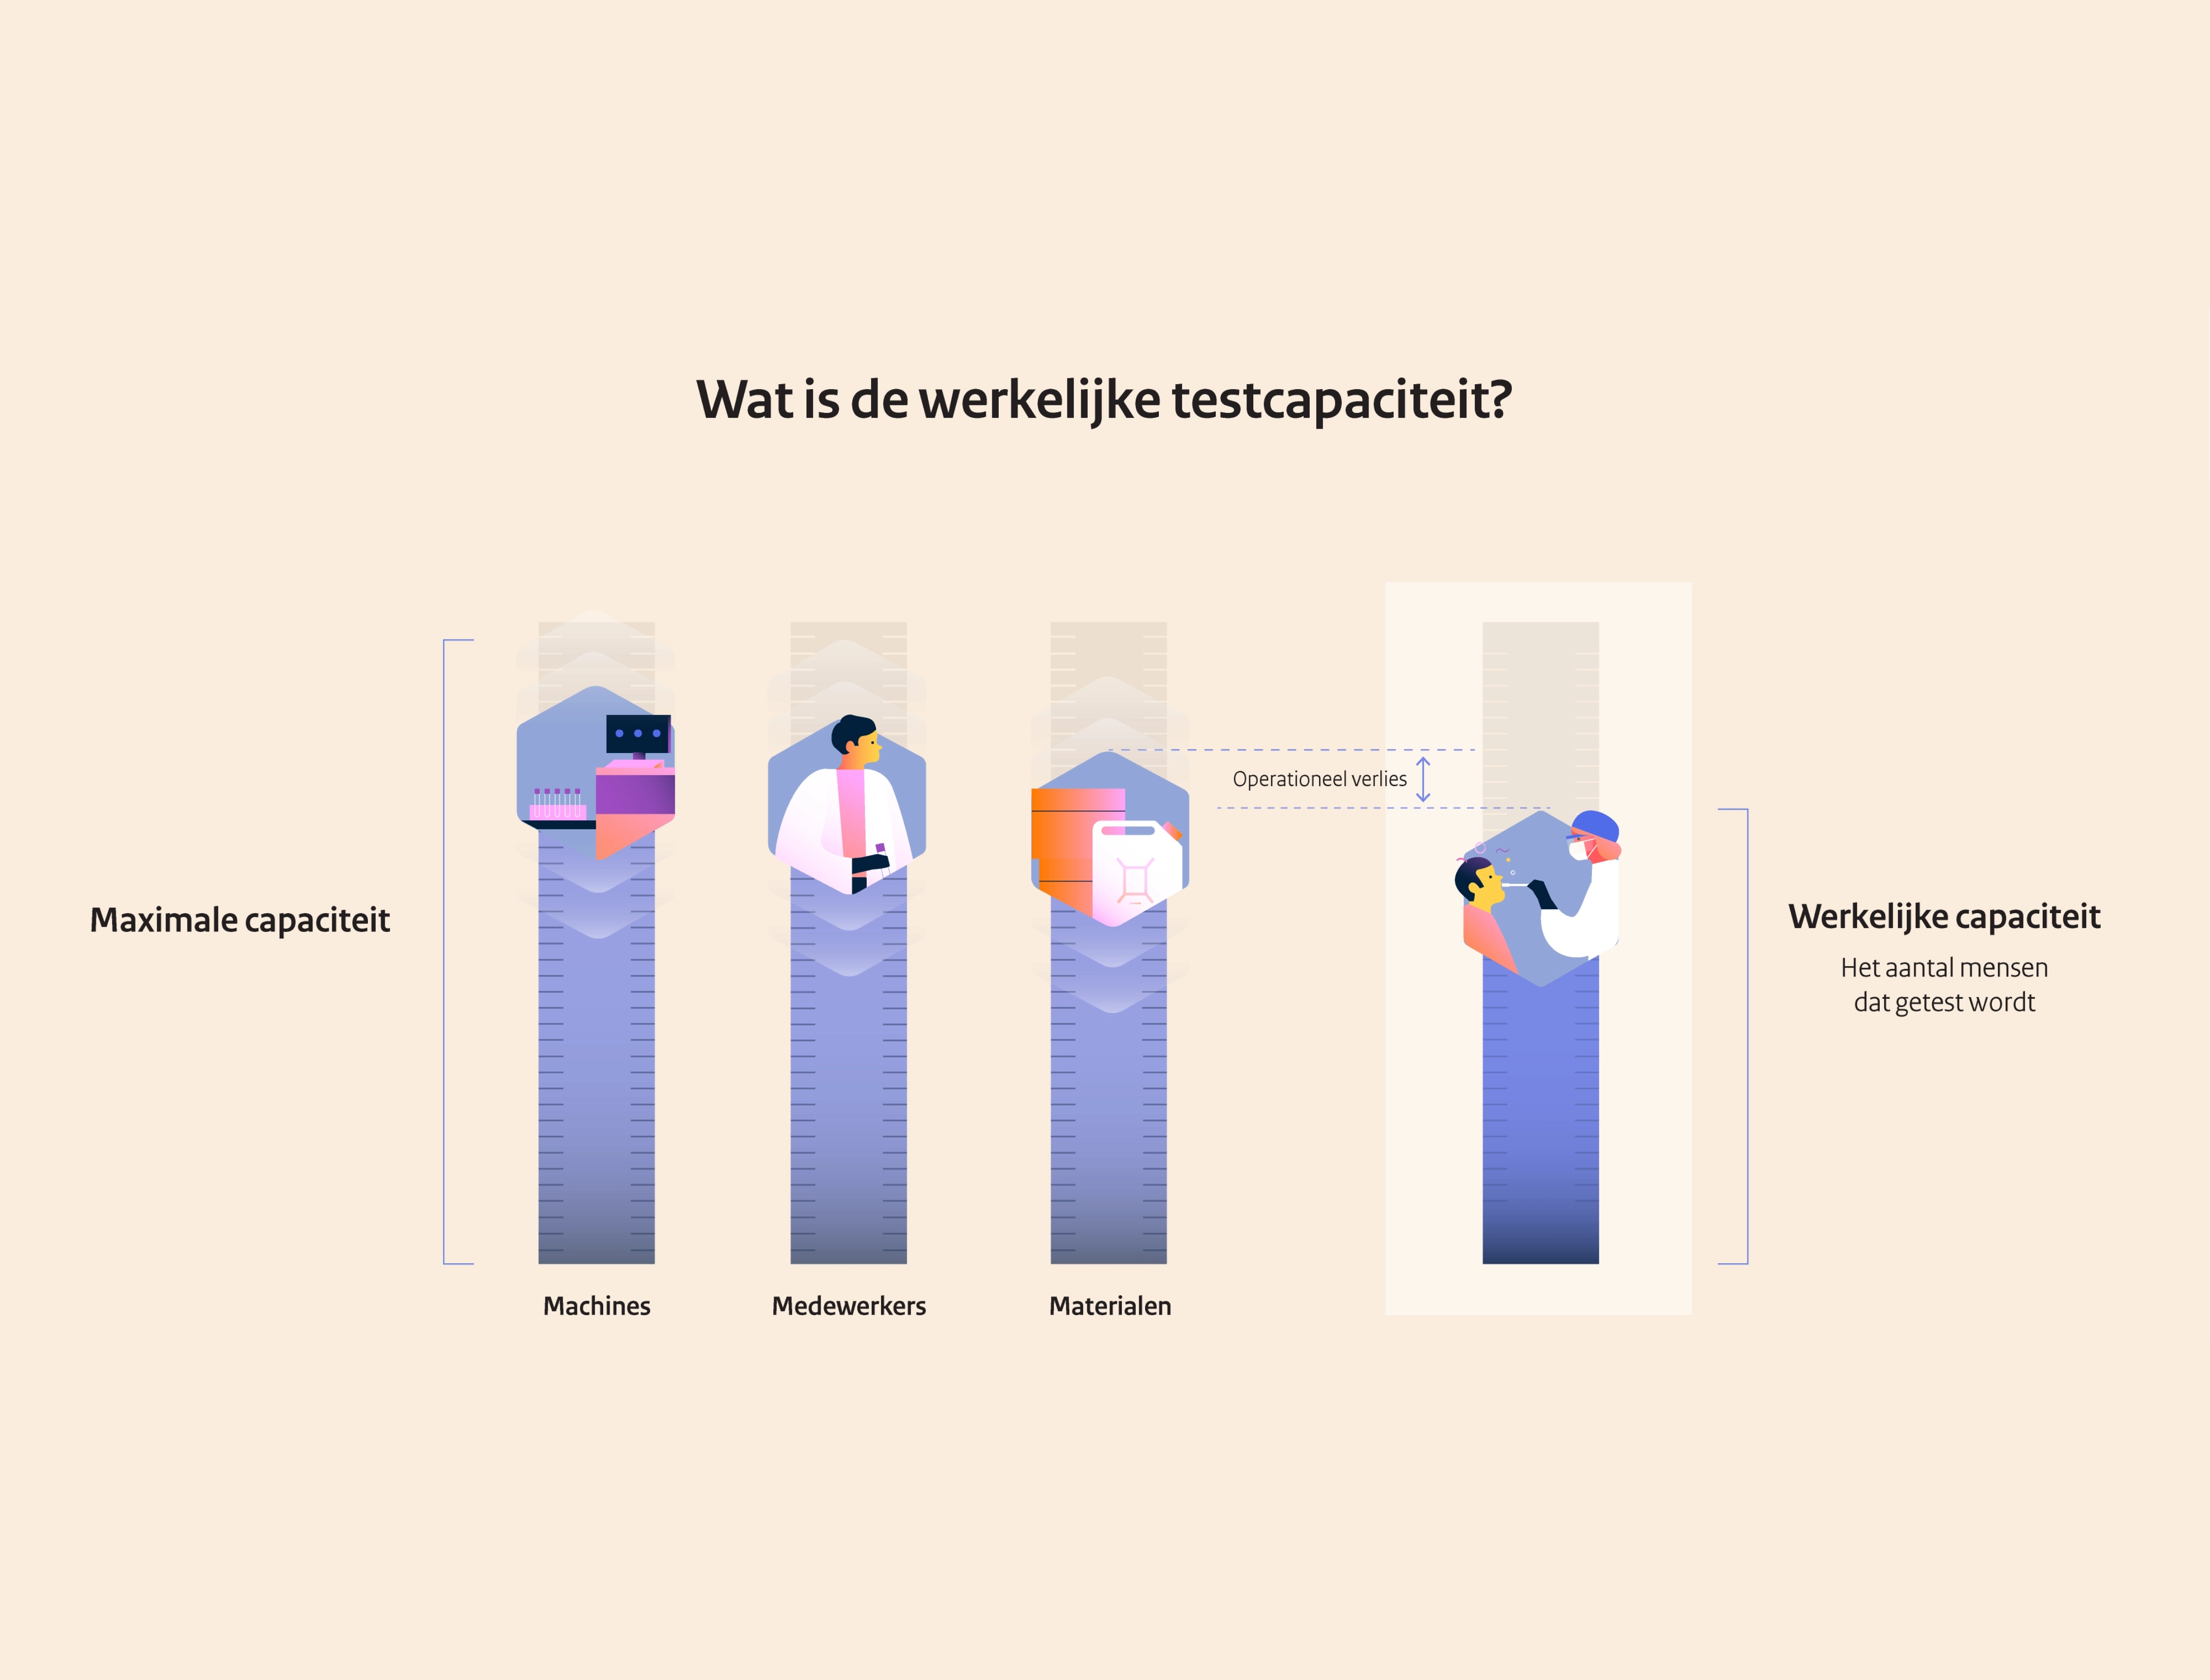
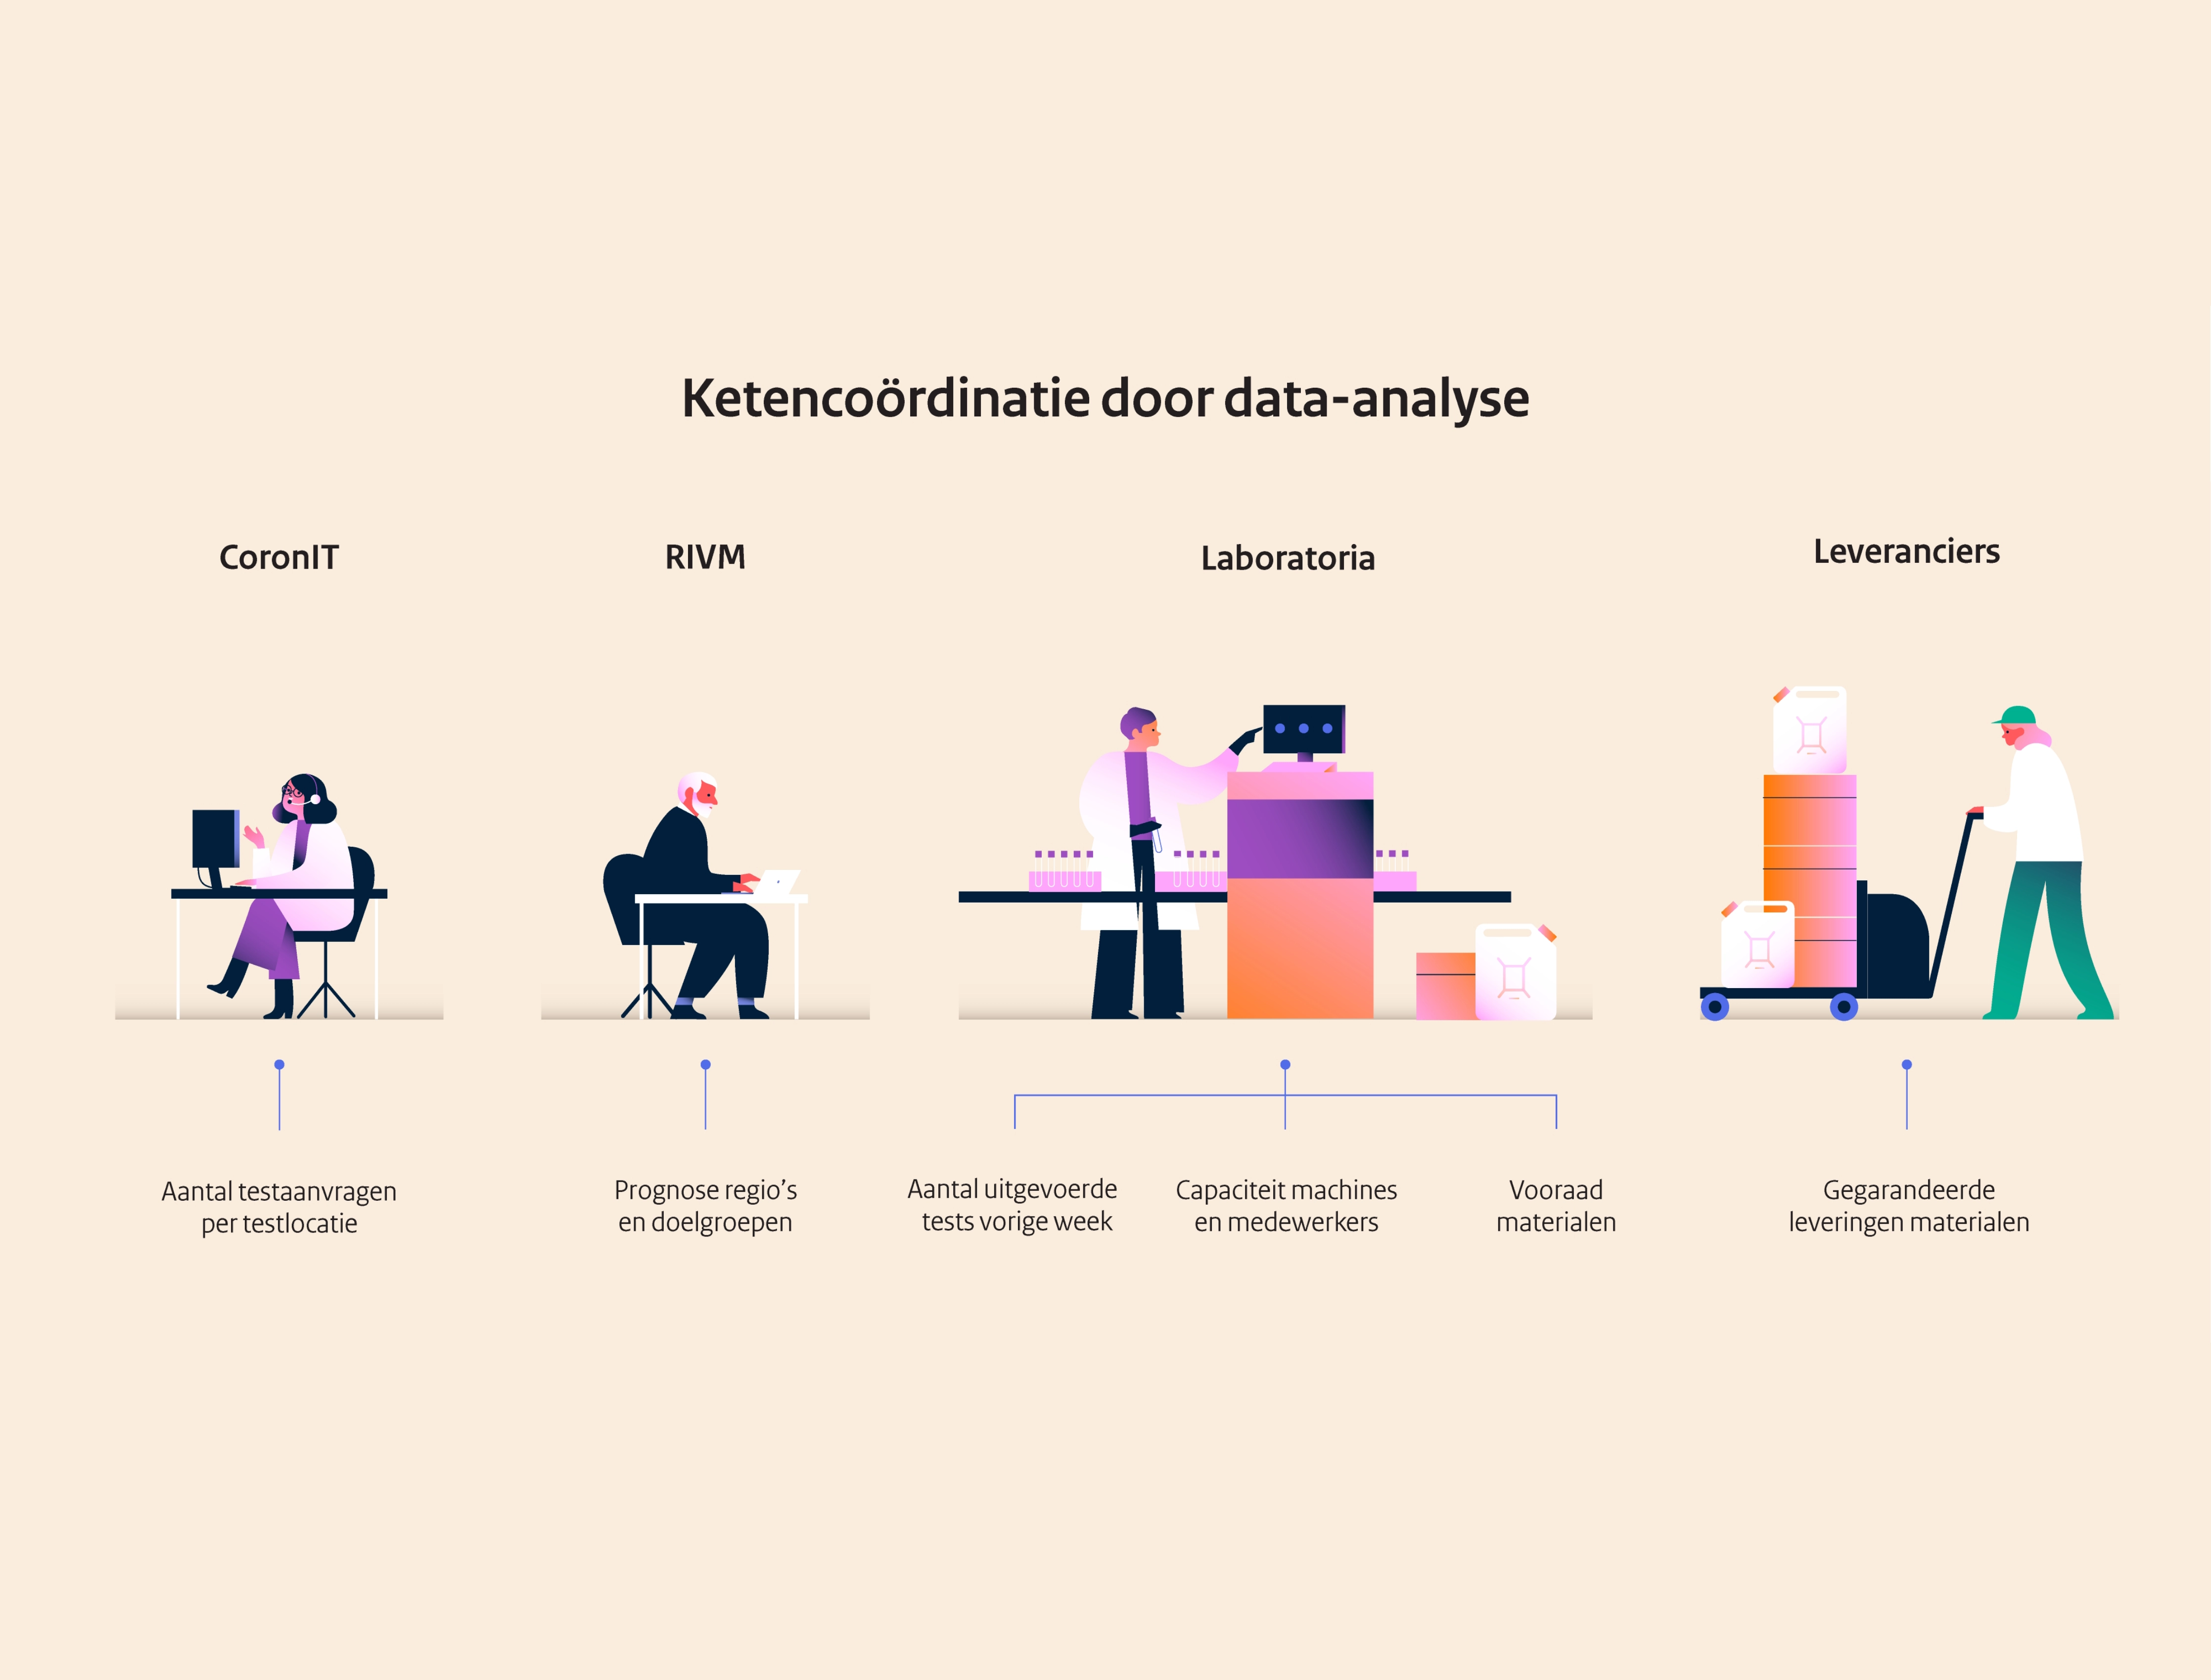
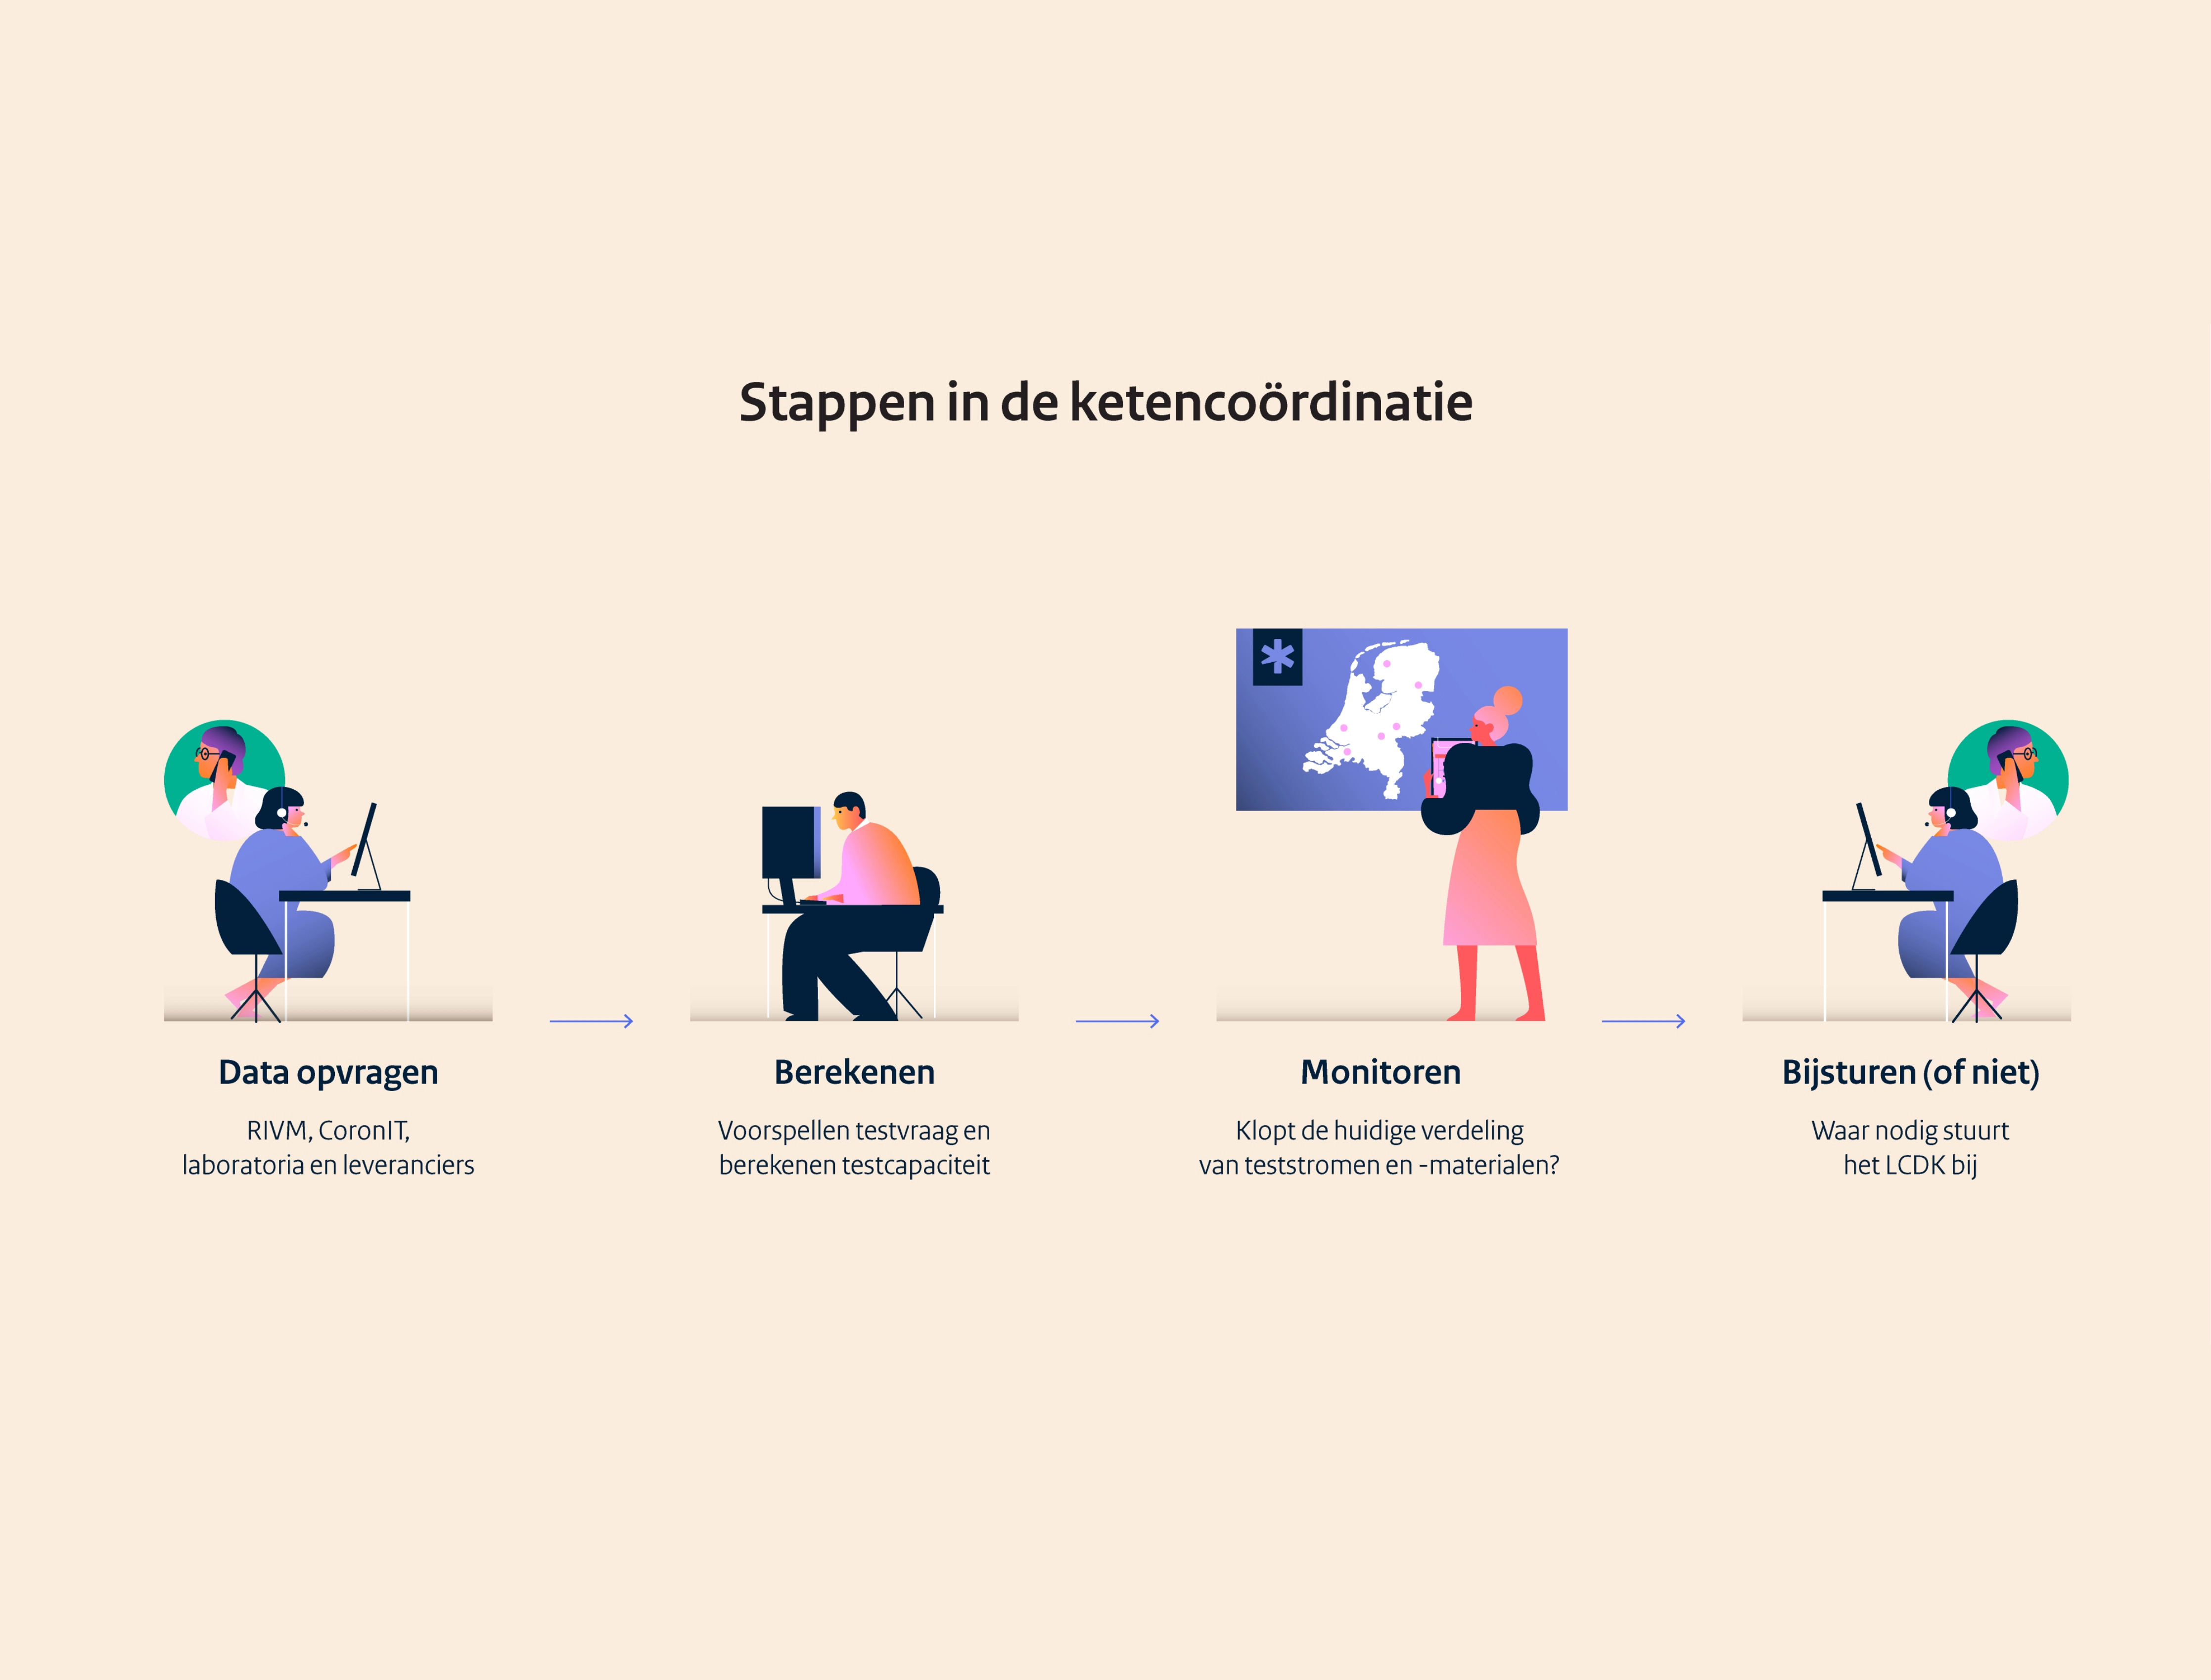
Clear graphics explain complex processes faster than an explanation in words. That is why the LCDK, responsible for scaling up testing capacity at Covid-19 in 2020, asked Zeppa to support their communication with visual graphics.
From functional sketches and a visual style, we developed the infographics. For LCDK, the functional sketches were the first clear representation of their work. They proved to be immediately useful for improving the test chain.
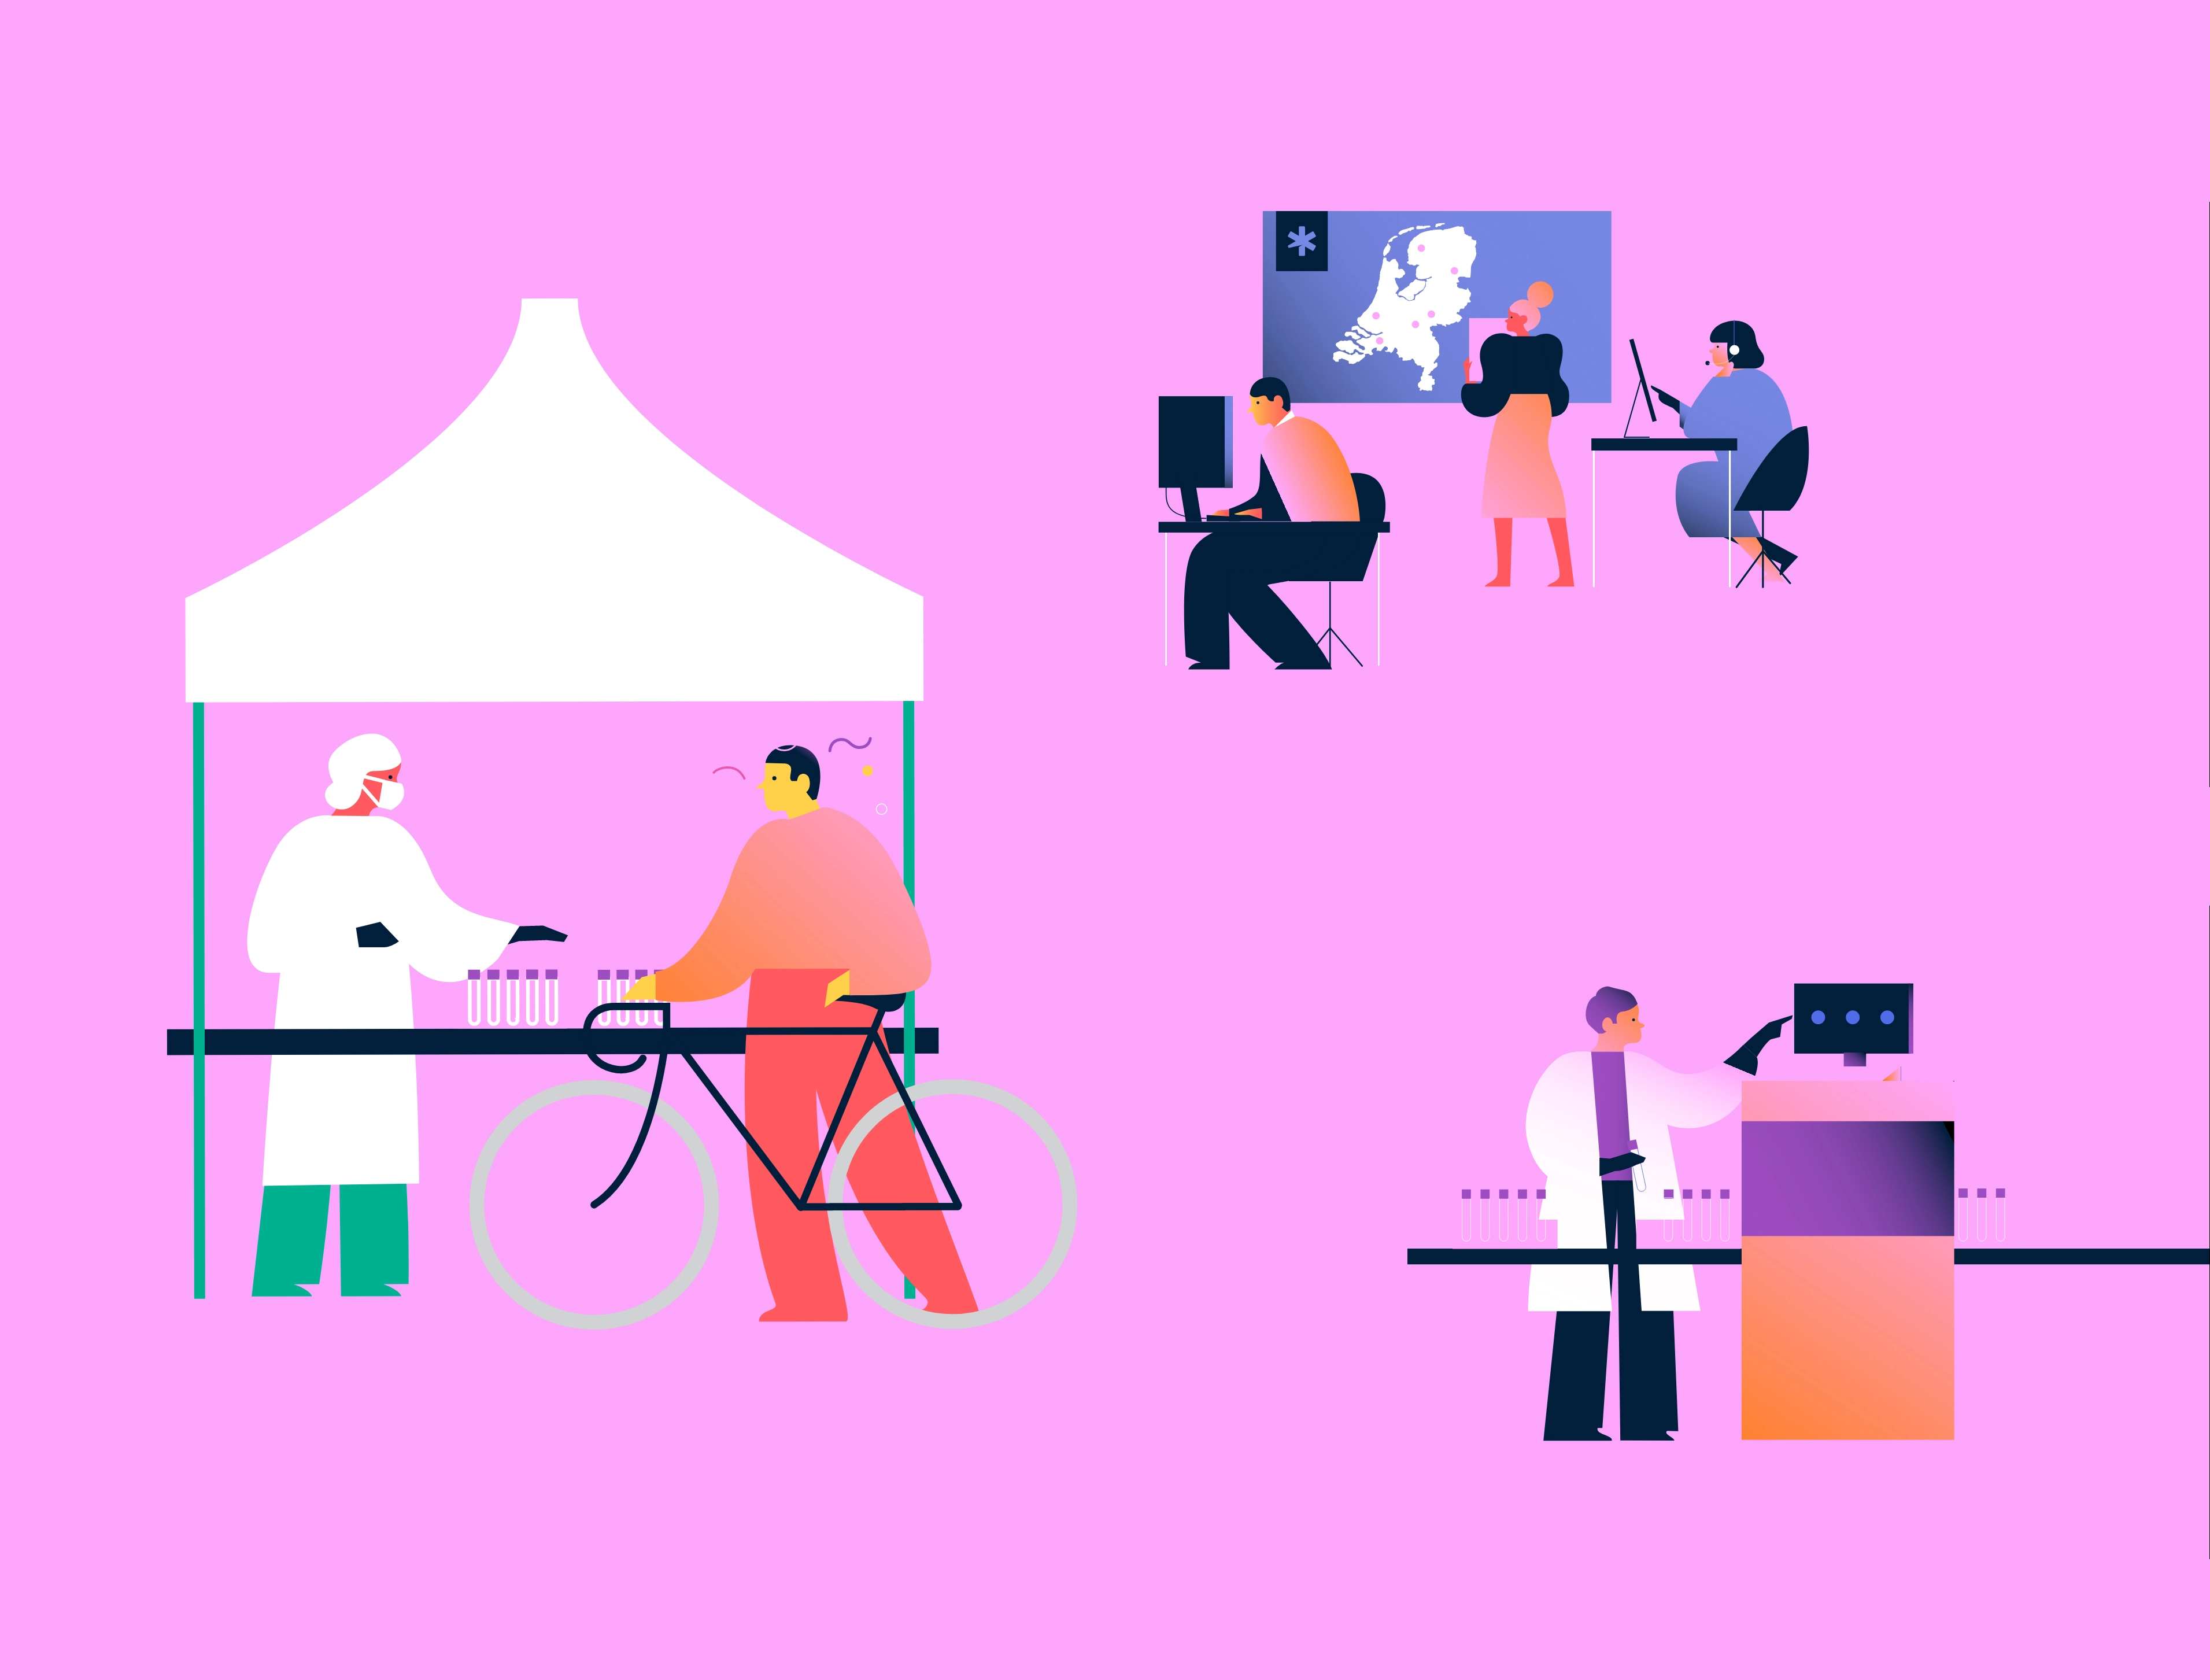
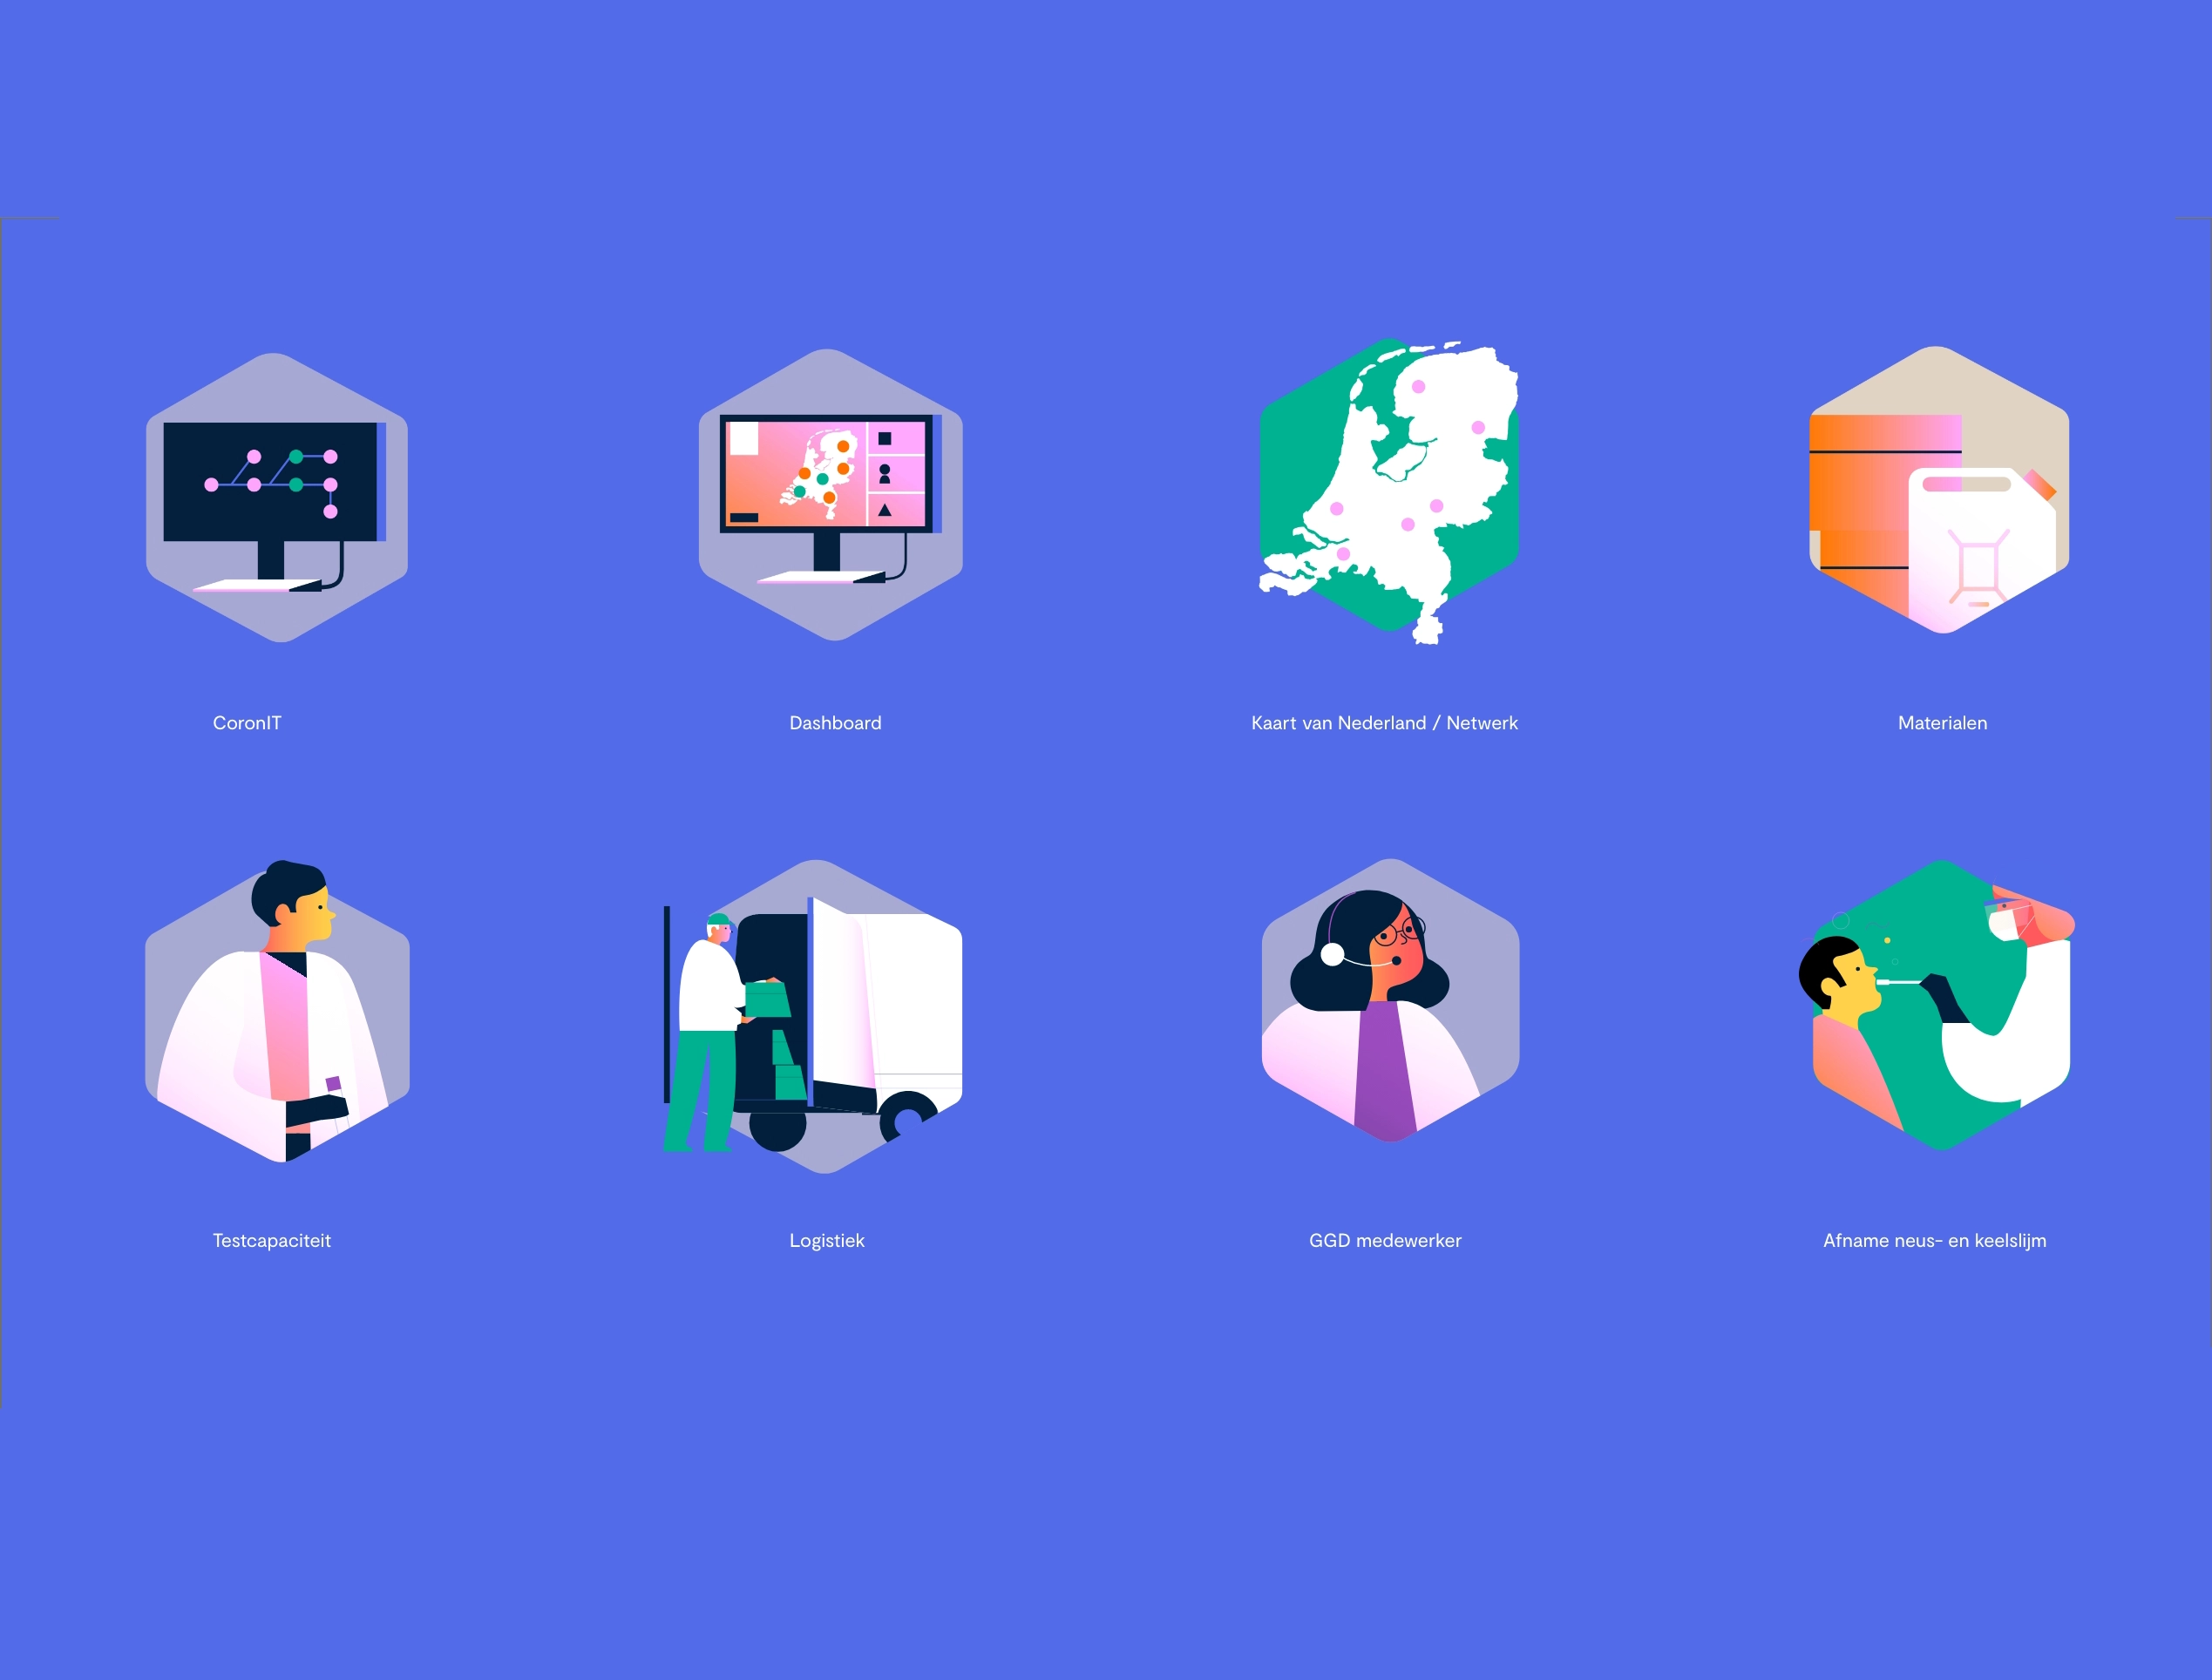
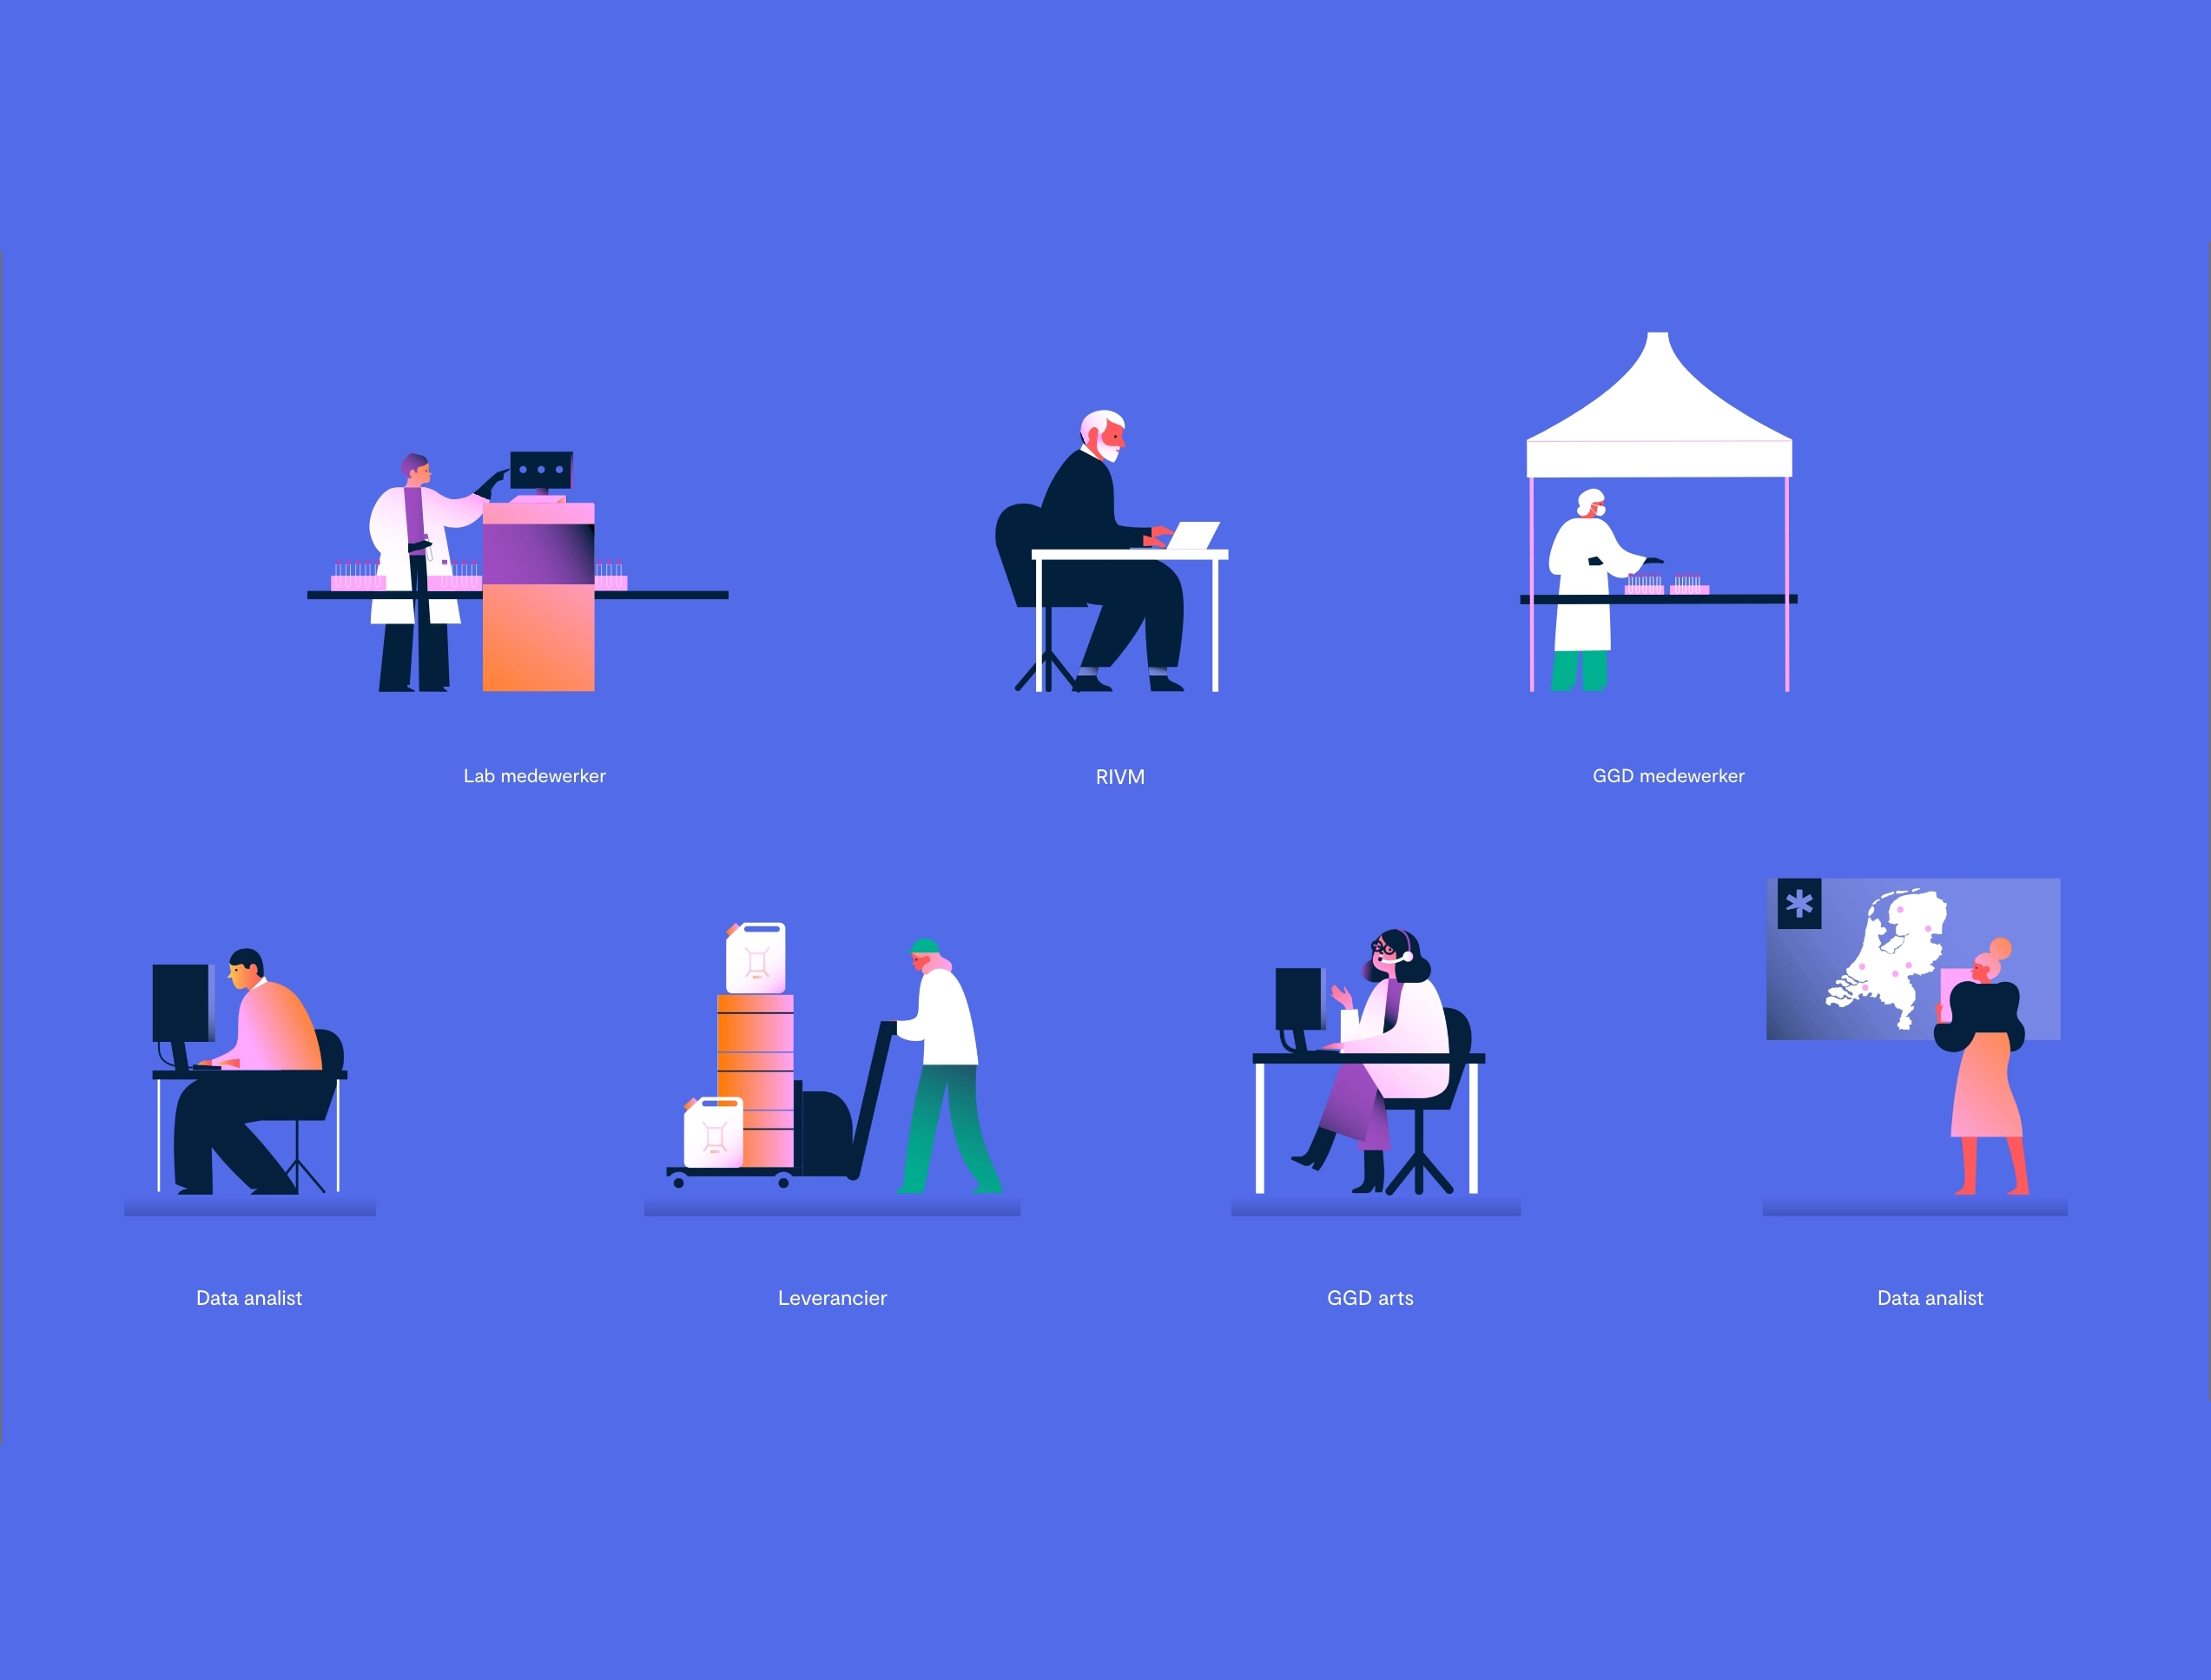
To move quickly with the developments of the LCDK, we developed a modular system for the graphics.
With recognisable symbols and simple graphics, we created a toolkit that allowed us to develop or adapt new graphics in a short time.


Heldere infographics die in één oogopslag tonen waar het over gaat.
Inzicht in complexe processen.
Een duidelijk beeld van de structuur van de organisatie. Ook goed te gebruiken in een onboarding procedure.


